INR
…
OMR
…
Land Area
 India
India
3,287,263 km²
Largest
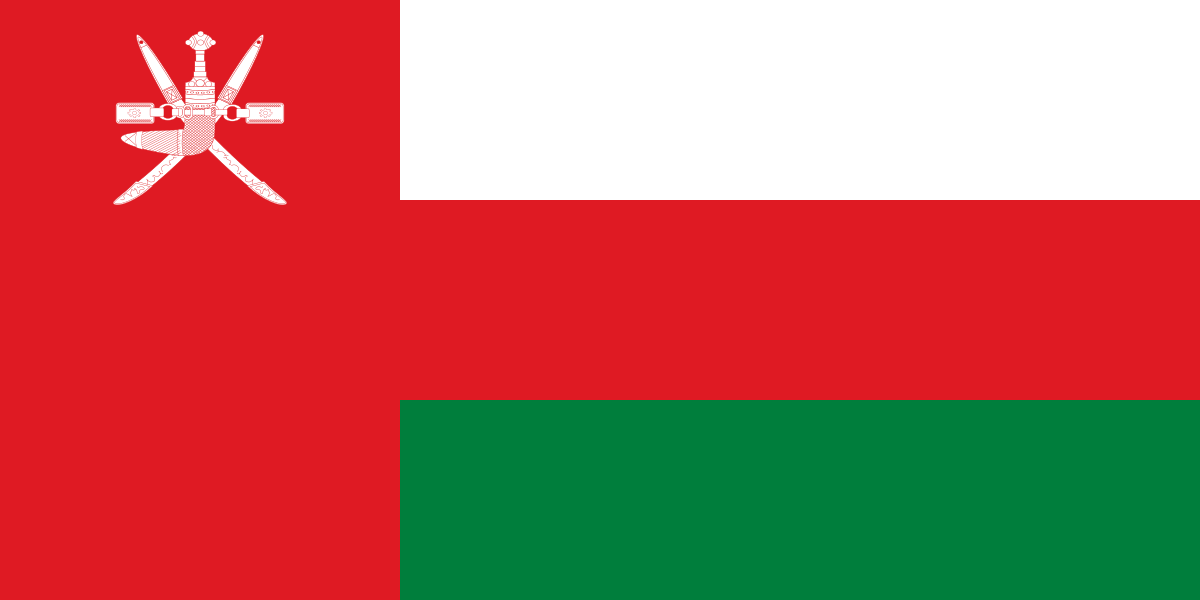 Oman
Oman
309,500 km²
9.4% of largest
India is 10.62× larger than Oman
Population
India
LARGEST
1.46B
PEOPLE
Oman
0.4% OF LARGEST
5.49M
PEOPLE
India has 266.41× the population of Oman
GDP
India
LARGEST
$3.96T
Oman
2.8% OF LARGEST
$109.6B
Armed Forces
Active Personnel
India
LARGEST
1.45M
TROOPS
Oman
2.9% OF LARGEST
42.6K
TROOPS
India has 33.92× the active personnel of Oman
Air Force
India
LARGEST
2.18K
AIRCRAFT
Oman
5.9% OF LARGEST
128
AIRCRAFT
India has 17.05× the aircraft of Oman
Naval Assets
India
Oman
Wealth
Gold Reserves
India
LARGEST
876.2
Metric Tonnes
Oman
0.8% OF LARGEST
6.7
Metric Tonnes
Foreign-Exchange Reserves
India
LARGEST
$570B
Reserves · excl. gold
Oman
3.2% OF LARGEST
$18B
Reserves · excl. gold
Billionaires
India
MOST
200
billionaires
Oman
—
Oil
Proven Reserves
India
LARGEST
4.5
Billion barrels
Production & Consumption
India
NET IMPORTER
Production
0.7M b/d
Consumption
5.3M b/d
−4.6M b/d net
Trade (Import/Export)
India
$827.4B
Exports
$827.4B
Imports
$918.3B
Trade Balance
$-90.9B
Trade Deficit
Oman
$70.8B
Exports
$70.8B
Imports
$52.3B
Trade Balance
+$18.5B
Trade Surplus
Drinks per Person
Coffee
kg / person / yr
Oman
supply
India
consumption
Tea
kg / person / yr
Oman
supply
India
consumption
Beer
litres / person / yr
India
supply
Oman
supply
Wine
litres / person / yr
Oman
supply
India
consumption
Alcohol
litres pure alcohol / person / yr
India
consumption
Oman
consumption
Smoking
% of adults 15+ who smoke
India
Oman
Per-capita — consumption where available, else FAOSTAT supply · alcohol = litres of pure alcohol; smoking = % of adults 15+ (WHO)
Olympic Medals
India
10
Gold
10
Silver
21
Bronze
41
Total Medals
☀ Summer: 41
❄ Winter: 0
Oman
No Olympic medal data
Religious Demographics
Religious Distribution
Religious Composition by Country
India
Oman
Age Demographics
Median Age
Oman
30.8
YEARS
10
30
50
70
India
28.2
YEARS
10
30
50
70
Age Distribution
Population breakdown by age bracket (percentage)
Demographic Insights
Age Gap
Oman is 2.6 years older (median) than India
Youth Population
India has the highest youth population at 52.5% (under 30)
Elderly Population
India has the highest elderly population at 8.5% (60+)
Global Statistics
| Metric |
India
|
Oman
|
|---|---|---|
| Travel & Mobility | ||
| Passport Power visa-free destinations |
62
|
— |
| Tourist Arrivals per year |
17.9M
|
— |
| Culture & Prestige | ||
| Nobel Laureates all-time |
10
|
0
|
| UNESCO Heritage Sites inscribed sites |
43
|
5
|
Figures as of 2026. Sources: IMF, EIA/OPEC, Henley Passport Index, UNWTO, Forbes, Michelin Guide, Nobel Foundation, UNESCO World Heritage Centre.
Cost of Living
|
Metric
All indices use New York City as base (100)
Lower values indicate lower costs.
|
India
|
Oman
|
|---|---|---|
| Cost of Living Index |
|
|
| Rent Index |
|
|
| Groceries Index |
|
|
| Restaurant Price Index |
|
|
| Local Purchasing Power |
|
|
| Common Expenses Comparison | ||
| Meal at Inexpensive Restaurant (USD) | $3 | $8 |
| Three-Course Meal for 2 (USD) | $15 | $39 |
| Monthly Rent - City Center (USD) | $250 | $770 |
| Monthly Rent - Outside Center (USD) | $150 | $462 |
| Monthly Utilities (USD) | $35 | $77 |
| Internet (60 Mbps, USD) | $12 | $19 |
| Monthly Public Transport Pass (USD) | $15 | $46 |
Health
Healthcare spending, capacity and outcomes. Sources: World Bank / WHO — the year tag shows each figure’s vintage; “—” means the country doesn’t report that metric.
Health spending / person
Oman
India
Physicians per 1,000
Oman
India
Hospital beds per 1,000
India
Oman
Diabetes prevalence
Oman
India
Obesity prevalence
Oman
India
Suicide rate per 100k
India
Oman
Want the long view?
GDP, population, reserves & trade for India vs Oman — charted over the decades.
Basic Information
| Metric | India | Oman |
|---|---|---|
| Population | 1463865525 | 5494691 |
| Area (sq km) | 3287263 | 309500 |
| Capital | New Delhi | Muscat |
| Official Language | Hindi and English (official), 21 other scheduled languages | Arabic |
| Currency | Indian Rupee (INR) | Omani Rial (OMR) |
| Government Type | Federal parliamentary constitutional republic | Absolute monarchy |
Military Strength
| Metric | India | Oman |
|---|---|---|
| Active Personnel | 1,445,000 | 42,600 |
| Reserve Personnel | 1,155,000 | 0 |
| Total Military Personnel | 2,610,550 | 42,600 |
| Defense Budget (USD) | $81,400,000,000 | $4,850,000,000 |
| Tanks | 4,614 | 154 |
| Armored Vehicles | 12,000 | 1,157 |
| Self-Propelled Artillery | 100 | 89 |
| Towed Artillery | 4,175 | 91 |
| Rocket Projectors | 266 | 140 |
Economy
| Metric | India | Oman |
|---|---|---|
| GDP (USD) | $3,956,067,115,772 | $109,604,780,696 |
| GDP Per Capita (USD) | $2,702 | $19,947 |
| Unemployment Rate (%) | 4.2% | 3.3% |
| GINI Index (Income Inequality) | 25.5 | 30.8 |
| Currency | Indian Rupee (INR) | Omani Rial (OMR) |
| Loading current exchange rates… | ||
Interesting Comparisons & Trivia
Did You Know?
India is 10.6 times larger in area than Oman.
That's a massive difference!
India has 266.4 times more people than Oman.
With over a billion people, that's more than 1/8 of humanity!
Oman has the highest GDP per capita at $19,947 among the selected countries.
India has the largest economy with a GDP of
$3.96 trillion.
India has the largest active military personnel with 1,445,000 troops.
India has the largest air force with 2,182 aircraft.
India has the largest navy with 295 vessels.
India Fact: India has the world's largest film industry, producing over 1,800 films annually, more than twice Hollywood's output.
India vs Oman: Key Comparisons
Economy: India's GDP of $4.0T is 36.1x larger than Oman's $110B — both among the world's largest economies.
Population: India's population of 1.5B is 266.4x larger than Oman's 5M.
Area: India covers 3,287,263 km², making it 10.6x larger than Oman.
Military: India fields 1.4Million active troops vs Oman's 43Thousand.
Trade: India has a trade deficit of $91B while Oman runs a trade surplus of $19B.
Life Expectancy: Oman leads with a life expectancy of 80 years vs India's 72.
Data compiled from World Bank, IMF, Global Firepower, SIPRI, Numbeo, and Pew Research.
Last updated August 2026.
Sources & methodology